Tensai asked me how I made my graphs in my ringtones post. I'd like to blather on about the graphs and why they're cool and how you can make them, because that's the sort of thing I'm good at.
In the olden days, the spectrogram was invented.

Originally greyscale, they are now usually portrayed in color, with "hot" colors meaning higher amplitude and "cool" colors meaning lower amplitude.
While there are myriad ways to view and/or generate spectrograms, the most convenient for me right now is to do it in Octave. If you're not familiar with Octave, it's a MATLAB clone. Octave is libre, MATLAB is insanely expensive. Obviously, I use Octave. I have used MATLAB previously (I had a beta copy, until it left beta), and for the most part they are quite comparable. Octave is a bit slower for some things (less optimized) but I've seen Octave outperform MATLAB on some specific tasks. The biggest impedance mismatch is in user interface stuff (MATLAB has sophisticated dialog support) and graphing. Octave has most of the essential graphing functionality (it uses gnuplot to render graphs).
So how do we generate a spectrogram in Octave? First we need to read in the WAV file, then we generate the spectrogram.
[x,sr] = wavread('logchirp.wav');
specgram(x,8192,sr);
8192 is the size of the FFT. I find 8192 is a nice compromise between time and frequency resolution (and computation time), but other powers of 2 (especially 1024) are common as well. Here's the chirp spectrogram:

Notice how the chirp is logarithmic. To our ears, this sounds like a steadily-rising tone. For this reason when dealing with music it's often better to look at a log-frequency spectrogram. Otherwise all the low frequencies are scrunched together and the relationships between different pitches (and harmonics) aren't constant. Here's a log-frequency spectrogram of the same chirp:
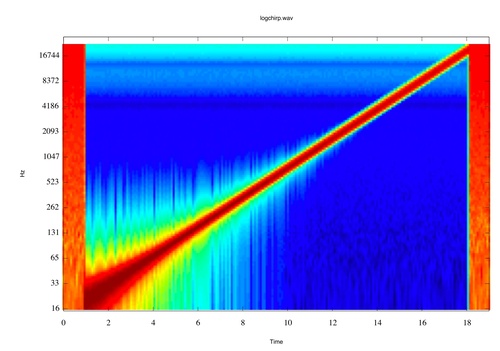
This was generated by the Octave code
logfsgram(x,8192,sr); title('logchirp.wav');Notice the bleed on the low frequencies, this is because we need a longer FFT in order to get more frequency resolution at low frequencies. This is a tradeoff in time resolution though, and processor time. Experiment with different FFT lengths for extra credit.
To use these functions you'll need to put the specgram and logfsgram "m-files" in your octave search path (current directory or whatever else you specify in your ~/.octaverc).